

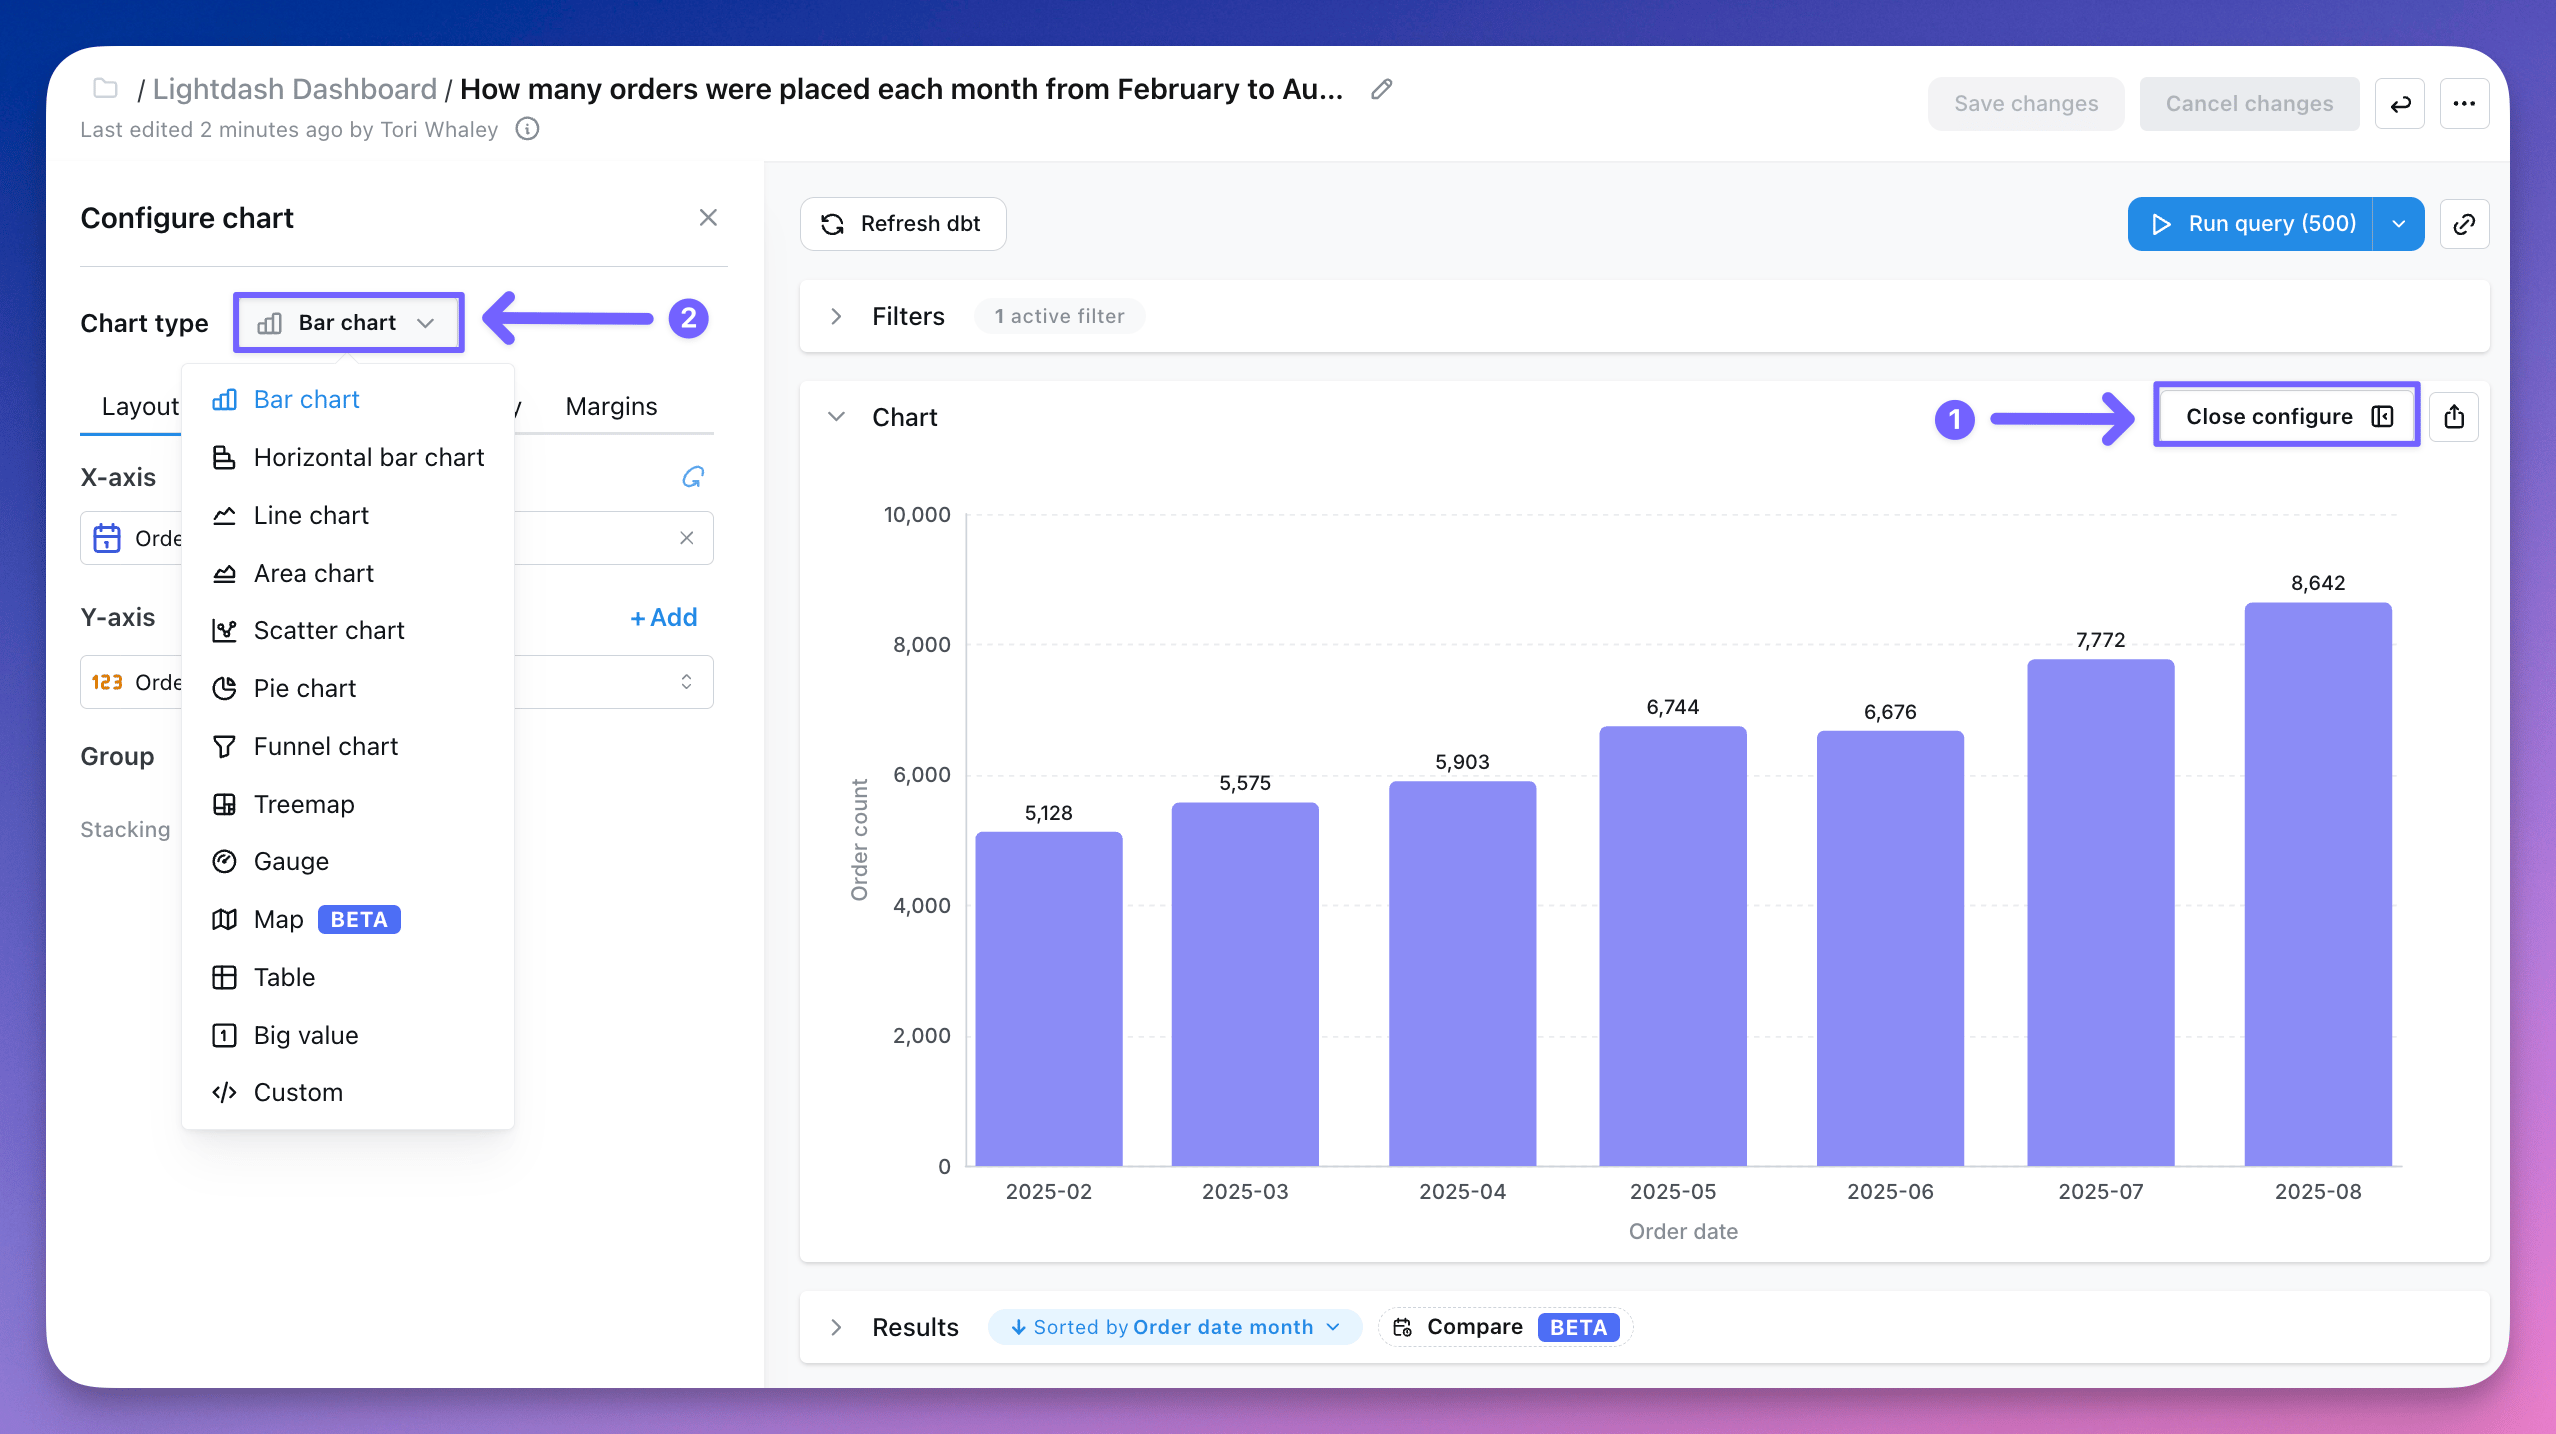
- Bar chart
- Horizontal bar chart
- Line chart
- Area chart
- Mixed chart
- Scatter chart
- Pie chart
- Funnel chart
- Treemap chart
- Sankey chart
- Table
- Big value
- Gauge
- Map
- Custom chart
Results tables can be useful for finding specific numbers or checking out your data, but it’s usually easier to see trends and make sense of your data using charts.